Choropleth map of the Balkans
Paste your numbers by country and get a colour-coded map with a legend.
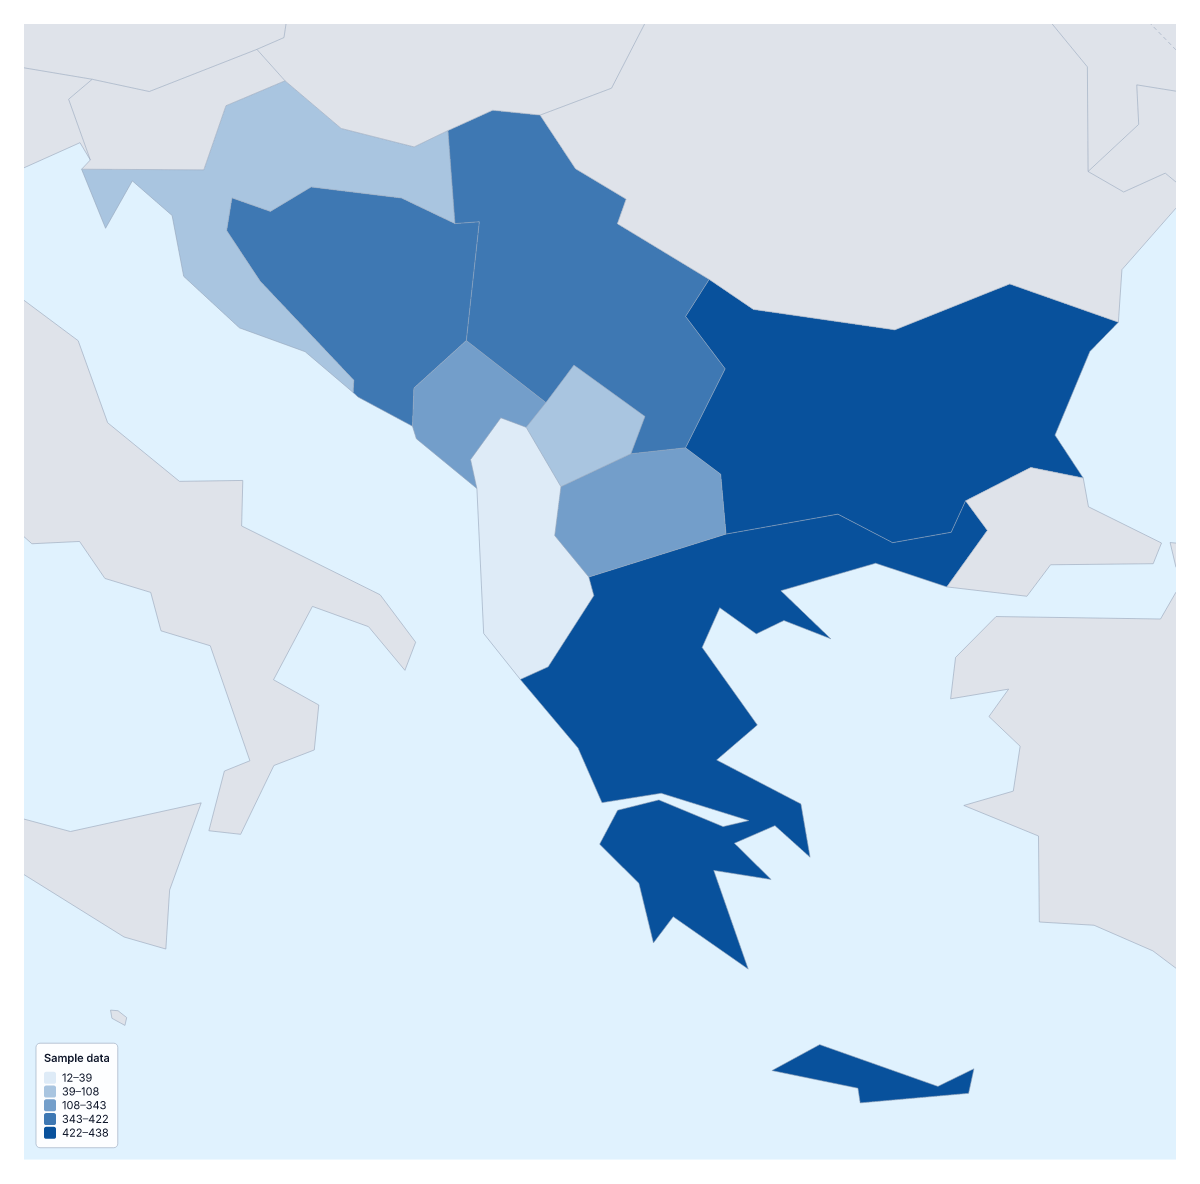
Your data on a map of the Balkans
If you have a figure for each country of the Balkans, such as sales, survey scores or visitor numbers, this page puts it on a map. Paste two columns from your spreadsheet, the country and its value, and Make my map opens the region with its nine countries coloured by your numbers. The colours above are sample values until you paste your own.
What a choropleth shows
A choropleth colours each area by a value: here each of the nine countries, usually darker for more, with a legend to read the shades by. It makes it easy to compare neighbours at a glance, and it reads best with rates, per person or per km², rather than totals. It shows no exact figures and no single places; for offices or venues, pins are the better tool.
What people map for the Balkans
Regional sales teams map orders or revenue per person by country for a review of their markets. Researchers and students map figures that come country by country, such as school results, broadband coverage or life expectancy. Travel writers and tourism boards map visitors or hotel nights. And for a project that runs in some countries and not others, the Categories method colours each country by a label, such as started, planned or not yet.
Getting your data in
One row per country: the name in the first column, the value in the second. The importer matches names in several spellings and languages, and ISO 3166 codes. Rows it cannot match are listed with suggestions, to fix or skip. The blank spreadsheet on this page lists all nine countries with an empty Value column. A paste can hold up to 5,000 rows and 2 MB, far more than nine rows need.
Choosing the colours
With nine countries, three colour steps is a sensible start; more, and some steps end up with one country or none. Quantile puts about the same number of countries in each step, while Equal steps gives each step the same range of values. A one-colour scale suits low-to-high data, and a two-colour scale suits change up or down from a midpoint. To set the region against the rest of the continent, add your figures on the choropleth map of Europe.
How to do it in MapMaker
- Copy the country column and the value column from your spreadsheet and paste them into the box.
- Choose Make my map to open the Balkans with your figures, or Upload a CSV for a table saved as a file.
- Fix or skip any rows the editor could not match, then choose three classes and a colour scale in the Data panel.
- Choose Download to save the map and its legend as a PNG, SVG or PDF.
Facts about the Balkans
This map shows the countries usually counted as the Balkans; some definitions add others. 9 members are on the map. The members are Albania, Bosnia and Herzegovina, Bulgaria, Croatia, Greece, Kosovo, Montenegro, North Macedonia and Serbia.
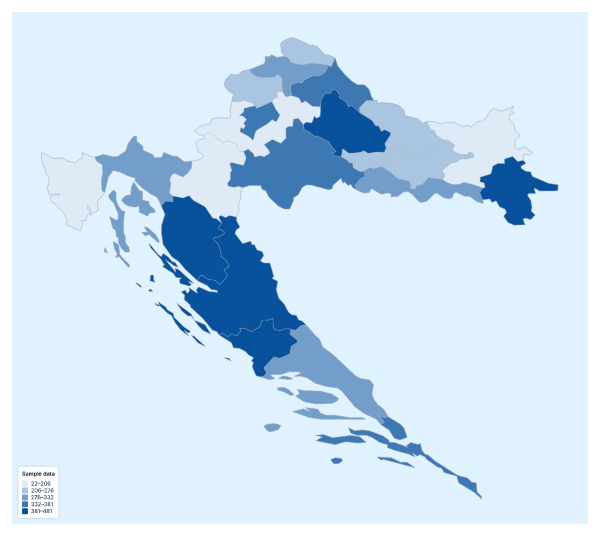
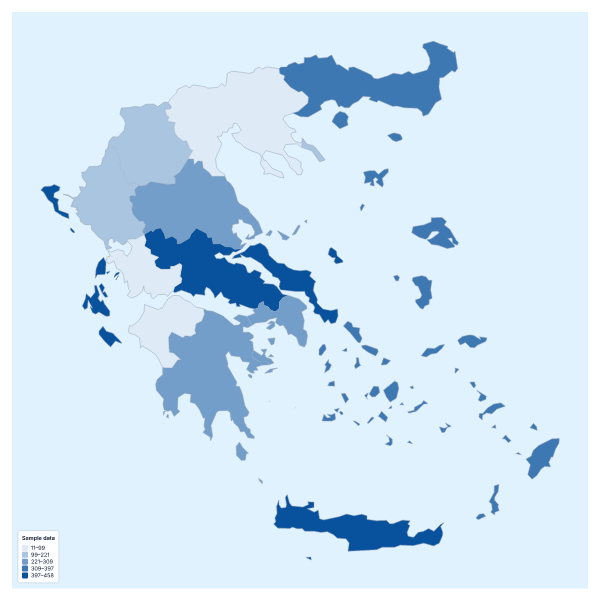
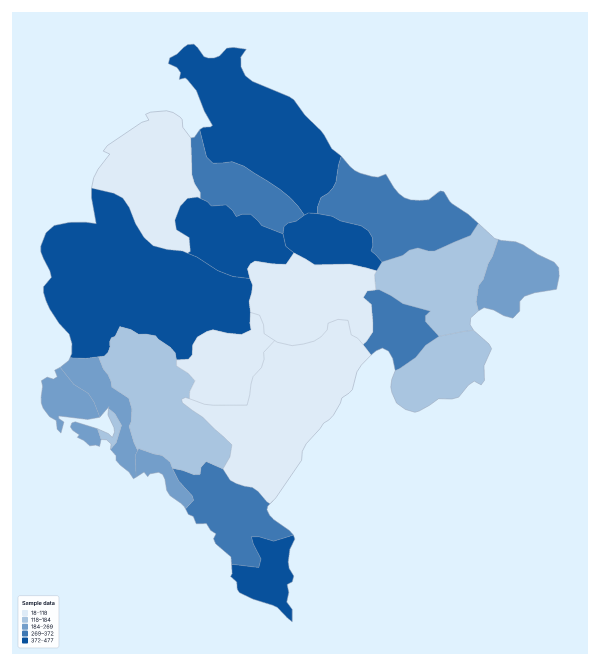
Maps of places in the Balkans
Questions people ask
Which countries can I add data for on the map of the Balkans?
The nine countries this map counts as the Balkans: Albania, Bosnia and Herzegovina, Bulgaria, Croatia, Greece, Kosovo, Montenegro, North Macedonia and Serbia. Give each one a row with its name and its value.
What happens if a country name doesn't match?
The editor lists the rows it could not match, each with suggestions. Pick the right country, ticking Remember this match if the same spelling comes up again, or skip the row. Common short forms such as Bosnia and Macedonia already match.
Can I map categories instead of numbers?
Yes. Put a label in the value column, such as the name of the partner that covers each country, and choose the Categories method in the Data panel. Each label gets its own colour and a line in the legend.