Choropleth map of Central Asia
Paste your numbers by country and get a colour-coded map with a legend.
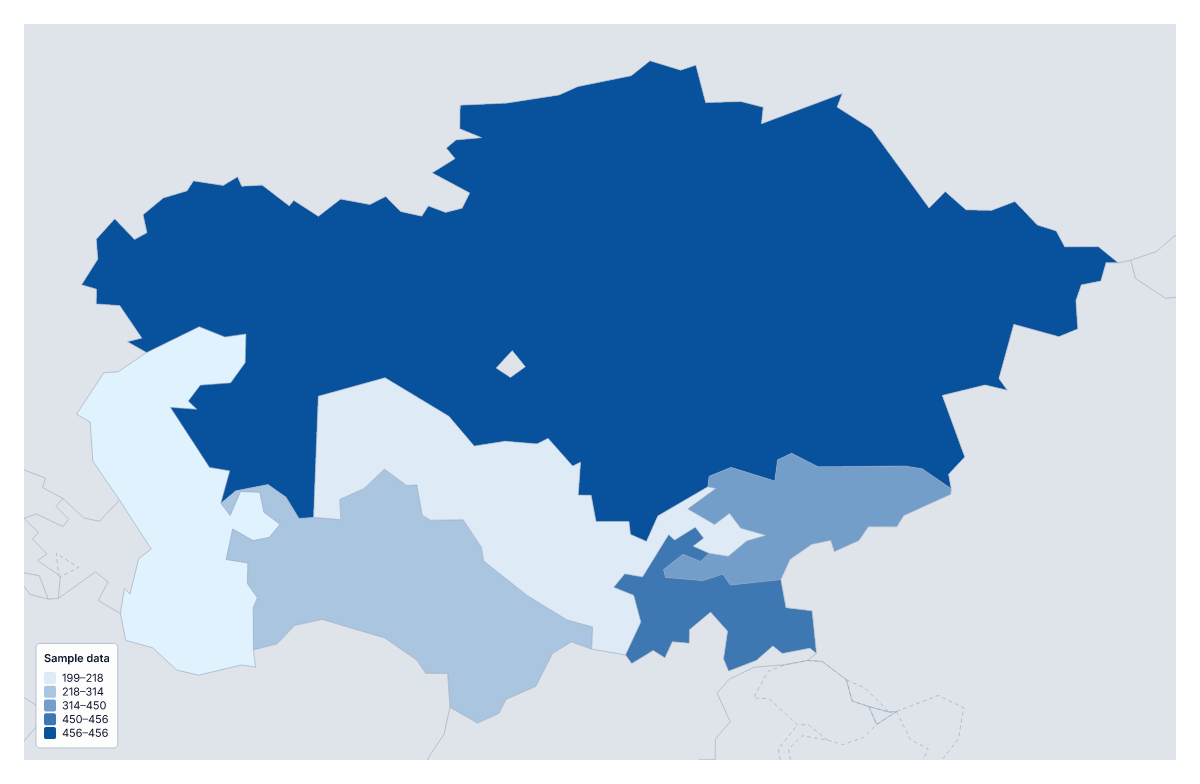
Your data on a map of Central Asia
If you have a figure for every country of Central Asia, this page puts it on a map. Paste two columns from your spreadsheet, the country and its value, and Make my map opens the region with its five countries shaded by your numbers. The colours above are sample values until you paste your own.
A short list, and what it means
A choropleth shades each area by a value, usually darker for more, with a legend to explain the shades. Five areas make an honest, quick comparison, but not a rich one: a reader sees at once which country is highest and which is lowest, and little more. Exact figures belong in a table beside the map.
Figures worth mapping
A company reviewing its markets can map sales per person across the five. Aid agencies and researchers map health, schooling or water figures as rates. A survey team shows one score per country on a single scale. The Categories method also works well for a short list: one colour for each partner organisation that covers a country, or for each stage a programme has reached.
Getting the table in
One row per country, name first and value second. The blank spreadsheet on this page has the five rows ready, so you fill in the Value column and paste it back. Several spellings and ISO 3166 codes match, and unmatched rows are listed. A paste can hold up to 5,000 rows and 2 MB.
Steps and colour
With five countries, use three steps or fewer, since a fourth would put a single country in some steps. Equal steps keeps the legend easy to read, and Quantile spreads the countries evenly. A single colour works for low-to-high data. To compare the region with its wider surroundings, add your figures to the choropleth map of Asia.
How to do it in MapMaker
- Copy the country column and the value column from your spreadsheet and paste them into the box.
- Choose Make my map to open Central Asia with your figures on its five countries.
- Fix or skip any rows the editor could not match, then set two or three classes in the Data panel.
- Choose Download to save the map and its legend as a PNG, SVG or PDF.
Facts about Central Asia
5 members are on the map. The members are Kazakhstan, Kyrgyzstan, Tajikistan, Turkmenistan and Uzbekistan.
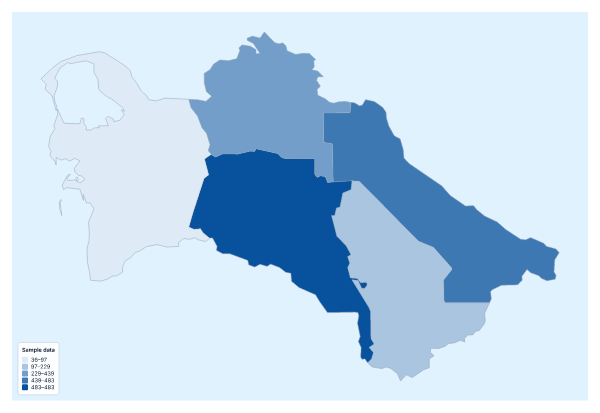
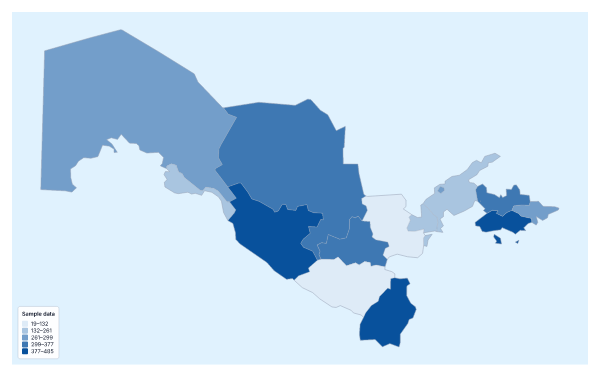
Maps of places in Central Asia
Questions people ask
Which countries can I add data for on the map of Central Asia?
Five: Kazakhstan, Kyrgyzstan, Tajikistan, Turkmenistan and Uzbekistan. Give each one a row, or download the blank spreadsheet on this page to get the five rows with a code each.
Is five countries enough for a choropleth?
Yes, for a comparison of five, though there is little to see in the map beyond which is highest. To put the five among more countries, paste the same table into the choropleth map of Asia.
Which names and codes for the countries does it recognise?
English names and other spellings, with or without accents, and ISO 3166 country codes. If your table spells a name differently, the unmatched row is listed with suggestions to fix or skip.
Can I map categories instead of numbers?
Yes. Put a label such as active or planned in the value column and choose the Categories method in the Data panel. Each label gets its own colour and a line in the legend.