Choropleth map of Eastern Europe
Paste your numbers by country and get a colour-coded map with a legend.
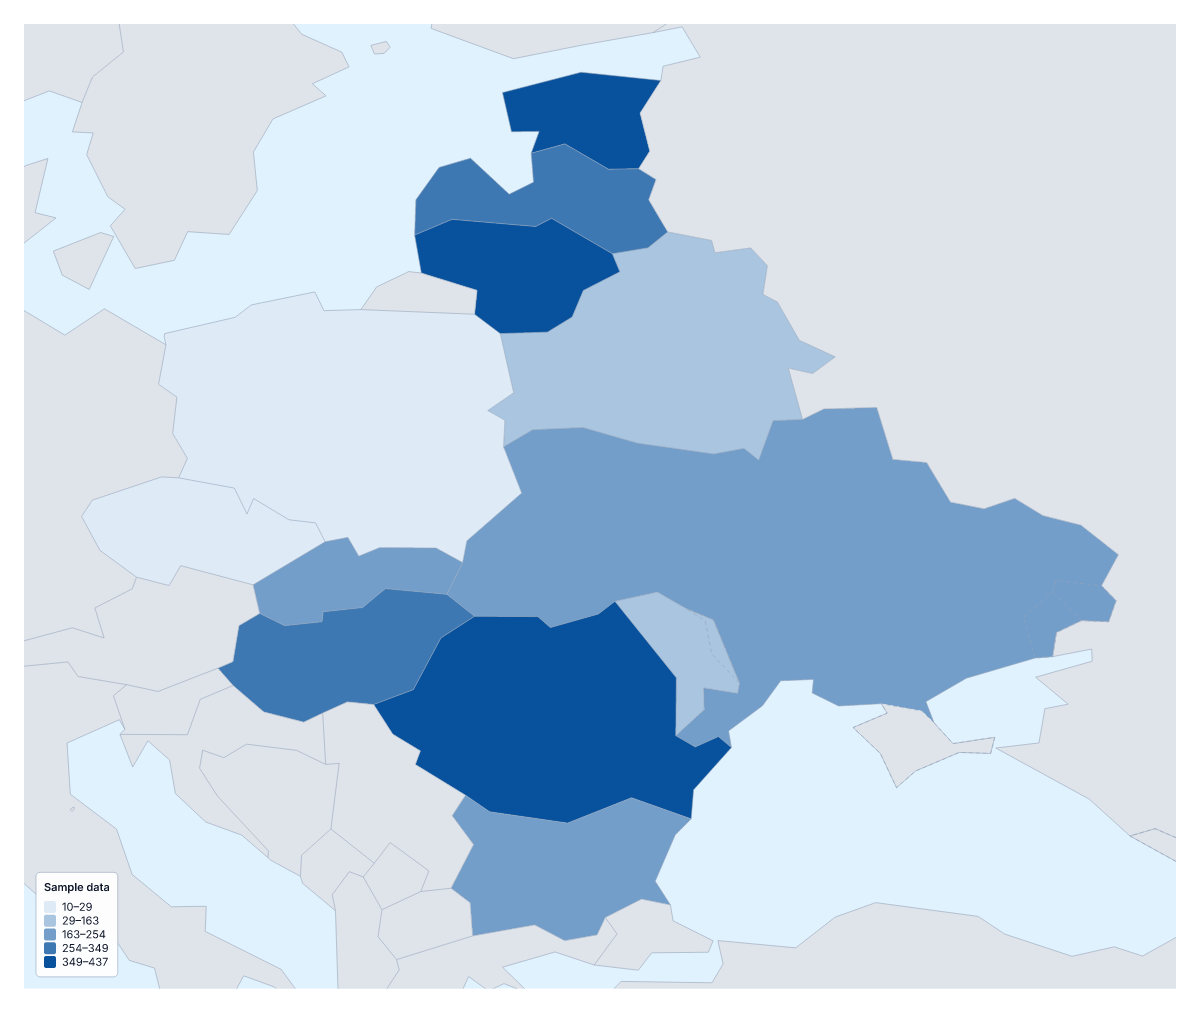
Your data on a map of Eastern Europe
Where you have one number for each country of Eastern Europe, such as customers, sales or survey scores, this page lays them out on a map. Paste two columns from your spreadsheet, the country and its value, and Make my map opens the region with its 12 countries shaded by your figures. The colours above are sample values until you paste your own.
What the colours do
A choropleth shades each area by a value, usually darker for more, and gives a legend to read the shades by. For 12 countries it lets a reader compare neighbours quickly. Use a rate, per person or per km², more often than a total, and use pins for single places such as warehouses.
Subjects for this region
Distributors map orders or revenue per person to find thin markets. Pollsters and researchers map turnout or survey answers, and the Categories method colours each country by a label such as which party won or which partner covers it. Economists and students map unemployment, wages or internet use. Tourism teams map visitors per resident.
Setting up the table
Use one row per country, with the name in the first column and the value in the second. Several spellings and ISO 3166 codes match. The blank spreadsheet on this page has all 12 rows, so you only fill in the Value column. Pastes of up to 5,000 rows and 2 MB are accepted, far more than 12 rows need.
Legend and scale
Keep to three or four steps. If one country is far above the others, Quantile stops it from stretching the whole scale, whereas Natural breaks gives it a step to itself. A one-colour scale fits low-to-high figures; a two-colour scale fits change either side of a midpoint, such as growth and decline. For a view with the wider continent, paste the same table into the choropleth map of Europe.
How to do it in MapMaker
- Copy the country and value columns from your spreadsheet and paste them into the box.
- Choose Make my map to open Eastern Europe with your figures on its 12 countries.
- Fix or skip any rows the editor could not match, then set three or four classes in the Data panel.
- Choose Download to save the map with its legend as a PNG, SVG or PDF.
Facts about Eastern Europe
This map shows the countries usually counted as Eastern Europe; Russia, which spans Europe and Asia, is drawn in grey. 12 members are on the map. The members are Belarus, Bulgaria, Czechia, Estonia, Hungary, Latvia, Lithuania, Moldova, Poland, Romania, Slovakia and Ukraine.
Maps of places in Eastern Europe
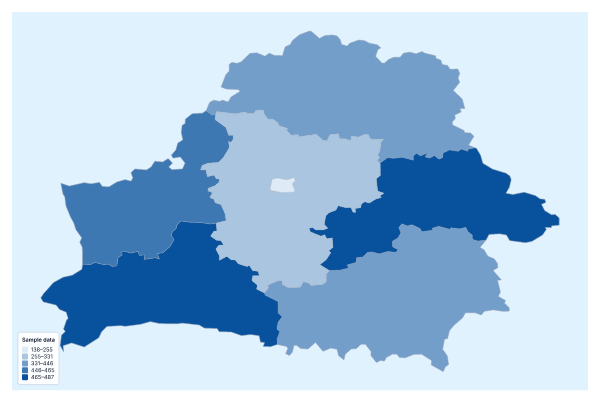
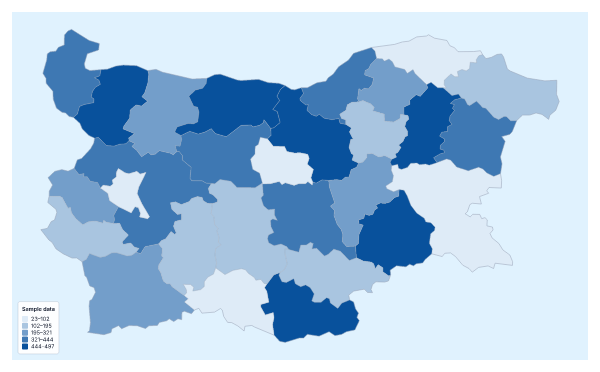
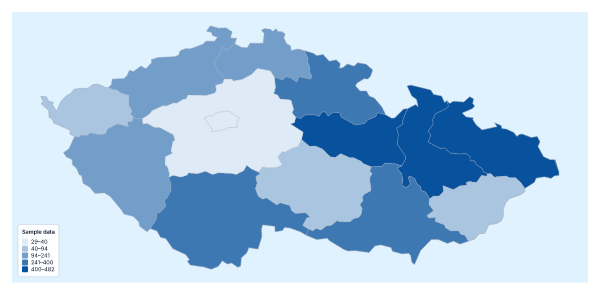
Questions people ask
Which countries can I add data for on the map of Eastern Europe?
The 12 countries on the map: Belarus, Bulgaria, Czechia, Estonia, Hungary, Latvia, Lithuania, Moldova, Poland, Romania, Slovakia and Ukraine. The blank spreadsheet on this page lists them with a code each.
What happens if a country name doesn't match?
The editor lists the rows it could not match, each with suggestions. Pick the right country, ticking Remember this match if the same spelling comes up again, or skip the row. Common short forms already match.
What happens to rows for countries outside the region?
Only the 12 countries on the map take a value. Rows for places not on the map are reported separately from rows that do not match, so you can leave them out.
How many colour steps should I use for 12 countries?
Three or four. With 12 countries, five or more steps leave some shades with a single country or none. Quantile spreads countries evenly across the steps; Equal steps divides the range of values.