Choropleth map of the Mediterranean
Paste your numbers by country and get a colour-coded map with a legend.
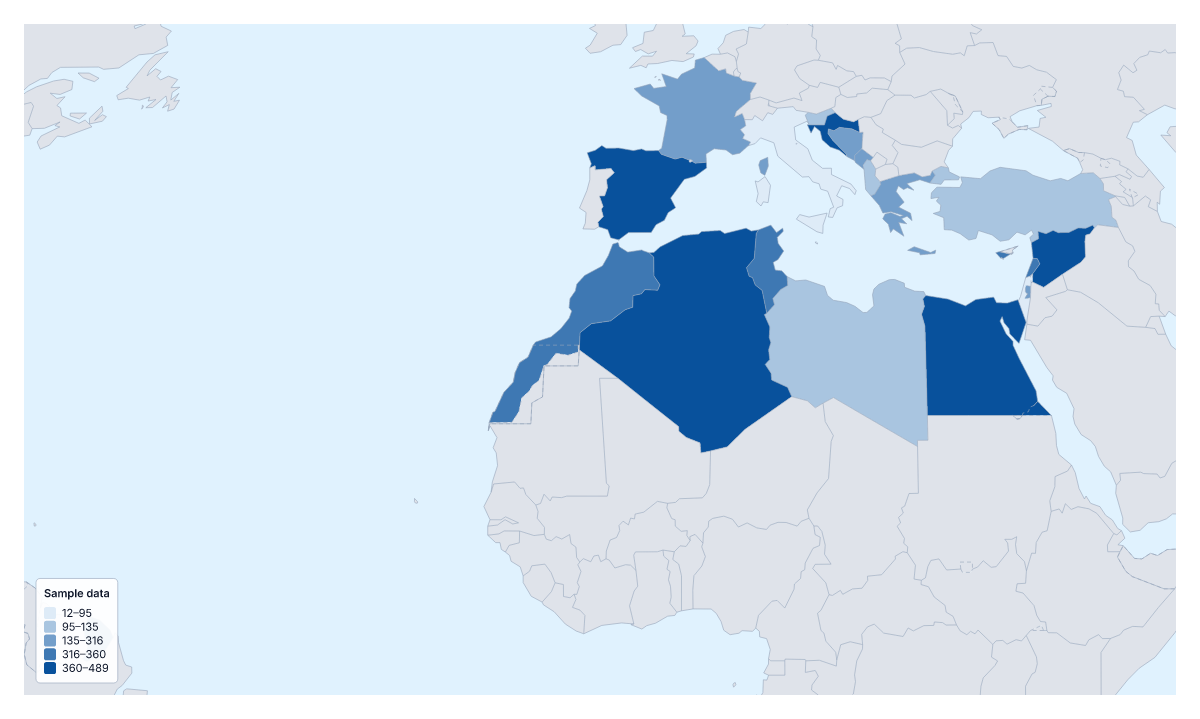
Your data on a map of the Mediterranean
A figure for every country around the Mediterranean can go onto one map here. Paste two columns from your spreadsheet, the country and its value, and Make my map opens the region with its 22 countries shaded by your numbers. The colours above are sample values until you paste your own.
Reading a choropleth
A choropleth shades each area by a value, usually darker for more, and a legend explains the shades. For 22 countries it is a fast way to see which are high and which low, as long as you map a rate, not a total. It will not show single points such as ports or branches; pins in the editor do that.
Figures that fit this map
Tourism is the obvious subject: visitors or hotel nights per person by country. A shipping or retail business can map orders or customers per head to see where it is thin. Researchers map water use or beach quality scores, and a survey team plots one satisfaction score per country on a single scale. The Categories method also fits a partner network, with a colour for each partner's territory.
The spreadsheet
One row per country, name first and value second. The blank spreadsheet on this page lists the 22 countries with codes, so you only fill in the second column. Names and ISO 3166 codes match; unmatched rows are listed to fix or skip. Pastes can hold 5,000 rows and 2 MB.
Steps and colours
Start with four or five colour steps and look at the legend: if two steps hold the same countries, use fewer. Choose a one-colour scale for low-to-high figures and a two-colour scale when values sit above and below a midpoint, such as growth and decline. For every country of Europe, paste a table into the choropleth map of Europe.
How to do it in MapMaker
- Copy the country and value columns from your spreadsheet and paste them into the box.
- Choose Make my map to open the Mediterranean with your figures on its 22 countries.
- Fix or skip any rows the editor could not match, then set four or five classes in the Data panel.
- Choose Download to save the map with its legend as a PNG, SVG or PDF.
Facts about the Mediterranean
This map shows the countries with a coast on the Mediterranean Sea. 22 members are on the map.
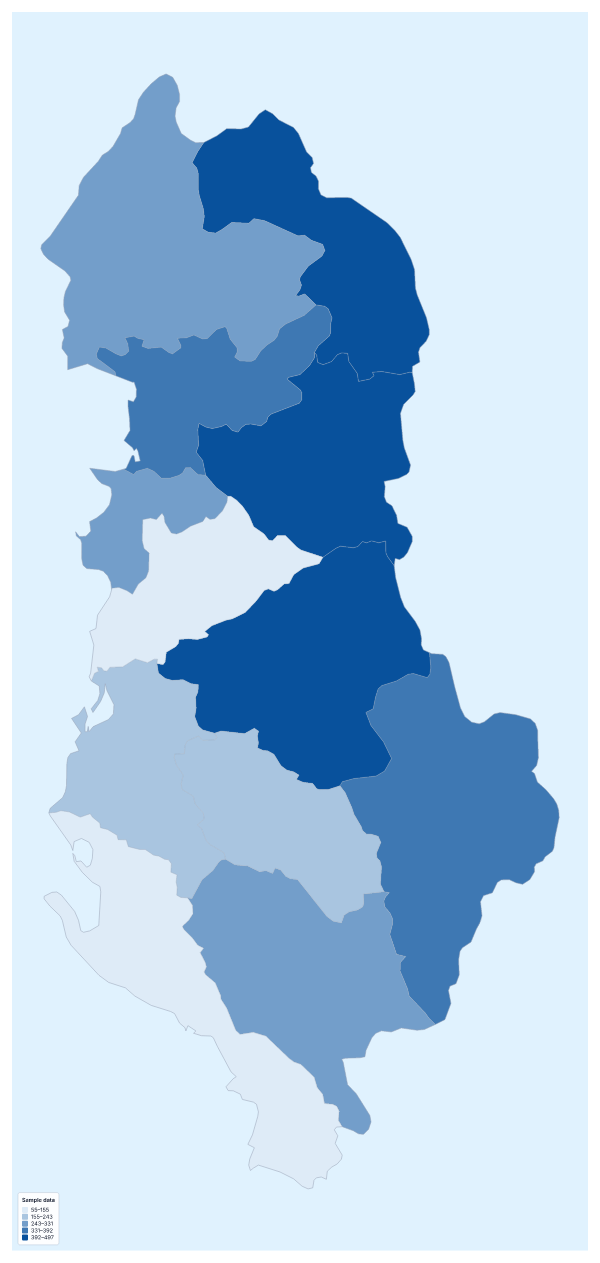
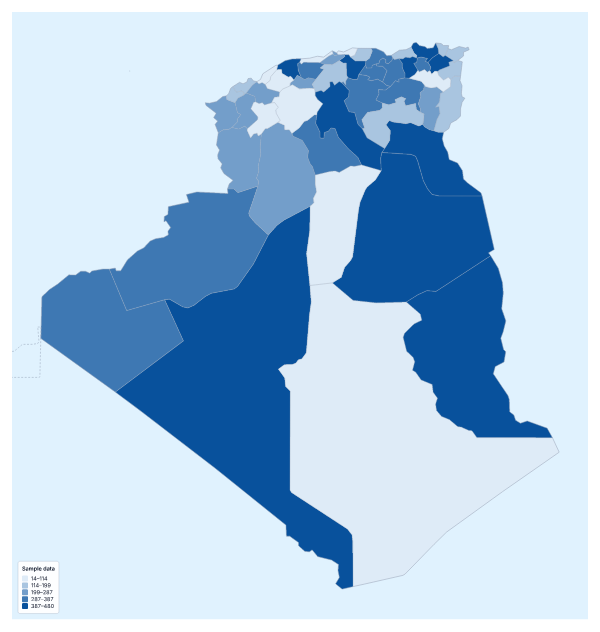
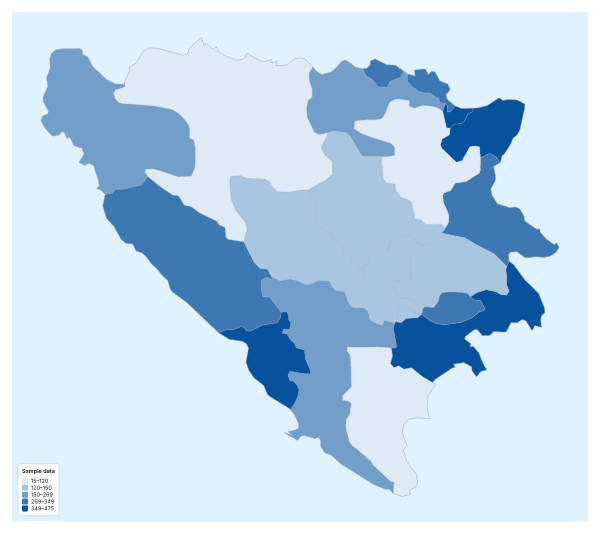
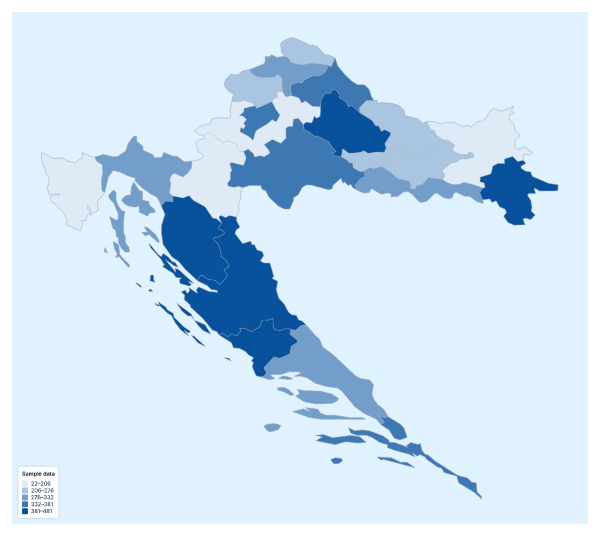
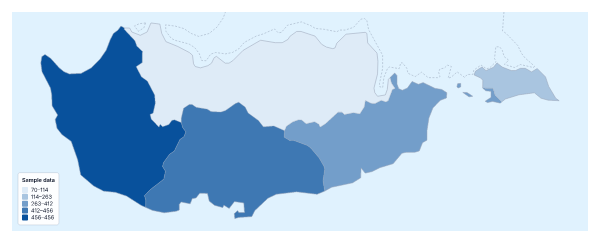
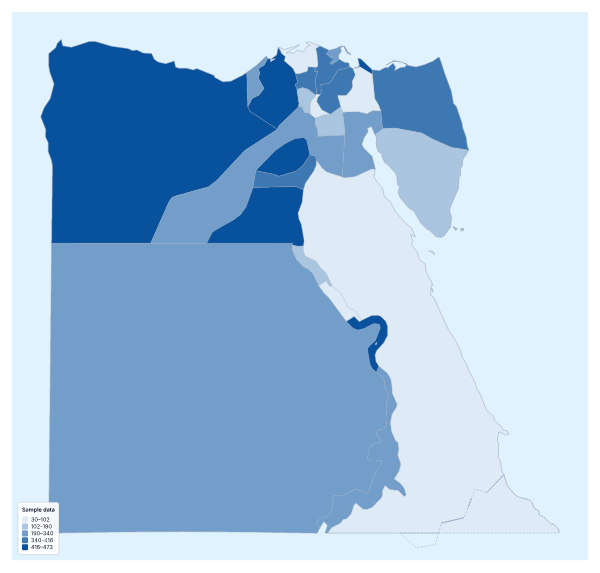
Maps of places in the Mediterranean
Questions people ask
Which countries can I add data for on the map of the Mediterranean?
The 22 countries on the map. Give each one a row, or download the blank spreadsheet on this page, which lists all 22 with a code the importer accepts and an empty Value column.
What if the names in my table are in another spelling?
The importer matches names in several languages and spellings, with or without accents, and ISO 3166 codes. Rows it cannot match are listed with suggestions, so you pick the right country or skip the row.
Can I map categories instead of numbers?
Yes. Put a label such as served or planned in the value column and choose the Categories method in the Data panel. Each label gets its own colour and a line in the legend.
How are the colour steps chosen?
You choose. Quantile puts about the same number of countries in each step, Equal steps divides the range of values evenly and Natural breaks follows the gaps in your figures. Four or five steps suit 22 countries.