Choropleth map of the US and Canada
Paste your numbers by country and get a colour-coded map with a legend.
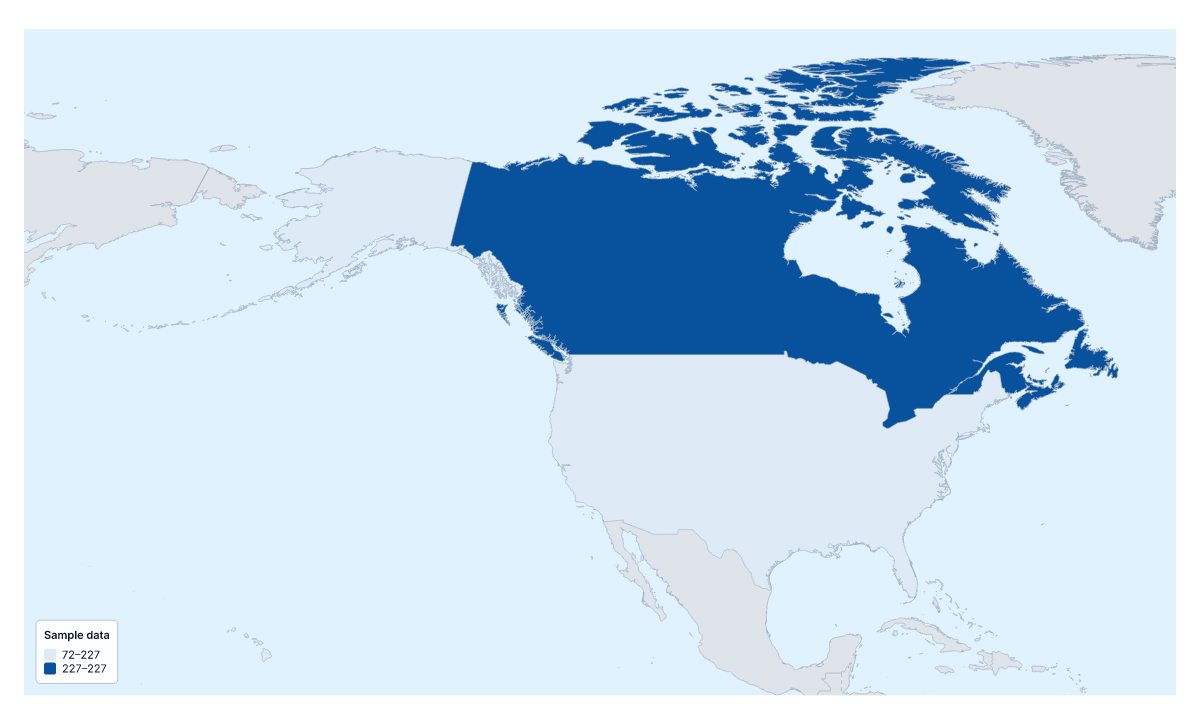
Your data on a map of the US and Canada
A choropleth of the US and Canada has two areas to colour, so it works as a head-to-head comparison: one figure per country, shown as two shades. Paste two rows from your spreadsheet, the country and its value, and Make my map opens the map with both coloured by your numbers. The colours above are sample values until you paste your own.
What to expect from two areas
A choropleth shades each area by a value, usually darker for more, with a legend to read the shades by. With two areas, the map shows which is higher and by roughly how much, not any pattern within a country. It is a clean visual for a one-line headline on a slide, and nothing more than that.
When you need more
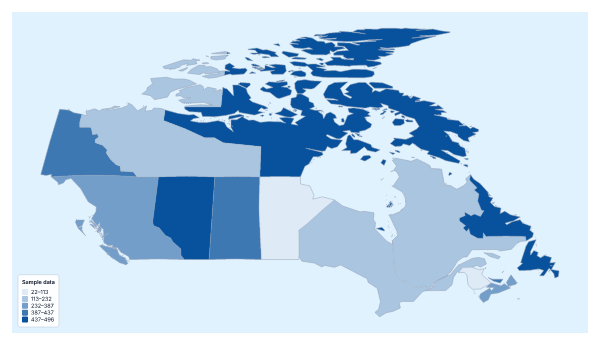
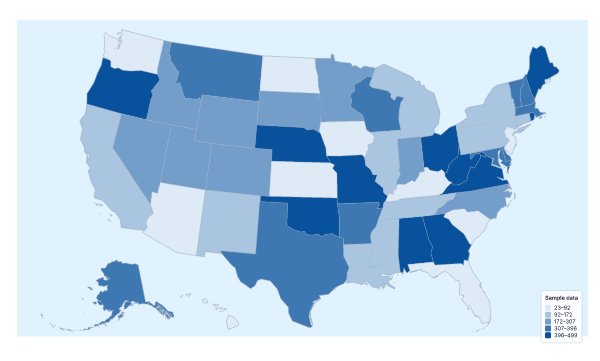
If your data is by state or by province, go straight to the choropleth map of the United States of America, which colours its states, or the choropleth map of Canada, which colours its provinces and territories. Each has a blank spreadsheet of its regions. Use this page only when the figure itself belongs to the country.
Figures that fit
Per-person measures compare fairly between two countries of different sizes: sales per person, customers per person, survey scores. A Categories map can also show a decision: one colour for a market served by head office, another for a partner. Keep it to rates, not totals.
The table
Two rows: the name in the first column and the value in the second. Several spellings and ISO 3166 codes match, and the blank spreadsheet on this page lists the two countries. Pastes of up to 5,000 rows and 2 MB are accepted, though two rows are all you need.
Colours
Two shades suffice: use two classes, so each country has its own colour. A one-colour scale reads best. For a wider view, add your figures to the choropleth map of North America.
How to do it in MapMaker
- Copy the country column and the value column from your spreadsheet and paste them into the box.
- Choose Make my map to open the US and Canada with your figures, or Upload a CSV for a saved file.
- Fix or skip any unmatched rows, then set two classes and a one-colour scale in the Data panel.
- Choose Download to save the map and its legend as a PNG, SVG or PDF.
Facts about the US and Canada
2 members are on the map. The members are Canada and United States of America.
Maps of places in the US and Canada
Questions people ask
Can I make a choropleth map of the US and Canada by state and province?
Not on this page, which colours the two countries as two areas. For states, use the choropleth map of the United States of America; for provinces, the choropleth map of Canada. Each colours the regions inside its country.
Which countries can I add data for on this map?
Two: Canada and the United States of America. Give each a row with its name and value, or download the blank spreadsheet on this page to get both rows with a code each.
Which names and codes does it recognise?
English names and other spellings, in any case and with or without accents, and ISO 3166 country codes.
Can I map categories instead of numbers?
Yes. Put a label such as launched or planned in the value column and choose the Categories method in the Data panel. Each label gets its own colour and a line in the legend.