Choropleth map of Western Europe
Paste your numbers by country and get a colour-coded map with a legend.
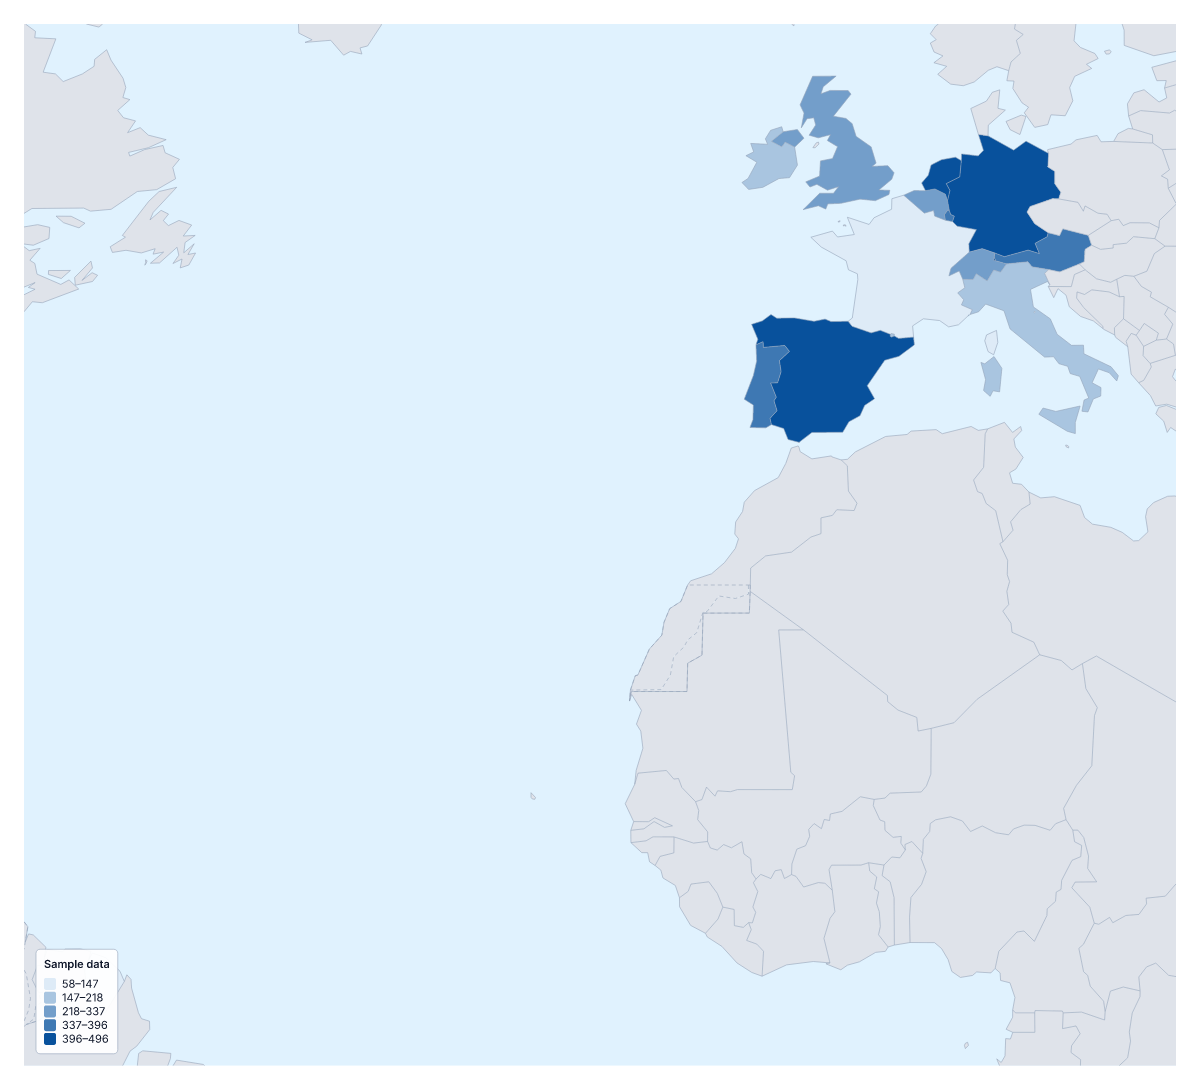
Your data on a map of Western Europe
If you have a figure for each country of Western Europe, such as sales, members, survey results or visitor numbers, this page turns it into a map. Paste two columns from your spreadsheet, the country and its value, and Make my map opens the region with its 17 countries coloured by your numbers. The colours above are sample values until you paste your own.
How a choropleth reads
A choropleth colours each area by a value: here each of the 17 countries, darker for more, with a legend that says what each shade stands for. It is good for comparing countries at a glance, and it reads best with rates rather than raw totals. It does not show exact figures or single points, such as stores; for those, use pins.
Data people map for Western Europe
European sales and marketing teams map revenue, orders or customers per person by country for a quarterly review. Researchers map health and education figures, such as hospital beds per person or school results. Travel and tourism data, such as hotel nights or visitors from one market, works the same way. And for a report on a single scheme, the Categories method colours each country by a label instead of a number: joined, in talks, not taking part.
Your spreadsheet
One row per country: the name in the first column, the value in the second. Names, other spellings and ISO 3166 codes all match. Rows the editor cannot match are listed with suggestions, to fix or skip. The blank spreadsheet on this page gives you every country with its code and an empty Value column. A paste can hold up to 5,000 rows and 2 MB.
Colours and steps
With 17 countries, four or five colour steps work well. Quantile puts roughly the same number of countries in each step; Equal steps gives every range in the legend the same width; Natural breaks finds the gaps in your figures. Monaco and San Marino are drawn small at this scale, so their shade may be hard to make out; if their values matter, a text box or a pin in the editor can point readers to them. To compare the whole continent, paste the same table into the choropleth map of Europe.
How to do it in MapMaker
- Copy two columns from your spreadsheet, the country and its value, and paste them into the box.
- Choose Make my map to open Western Europe with your figures on its 17 countries.
- Fix or skip any rows the editor could not match, then choose a method and four or five classes in the Data panel.
- Choose Download to save the map with its legend as a PNG, SVG or PDF.
Facts about Western Europe
This map shows the countries usually counted as Western Europe, from the UK and Ireland to Italy. 17 members are on the map.
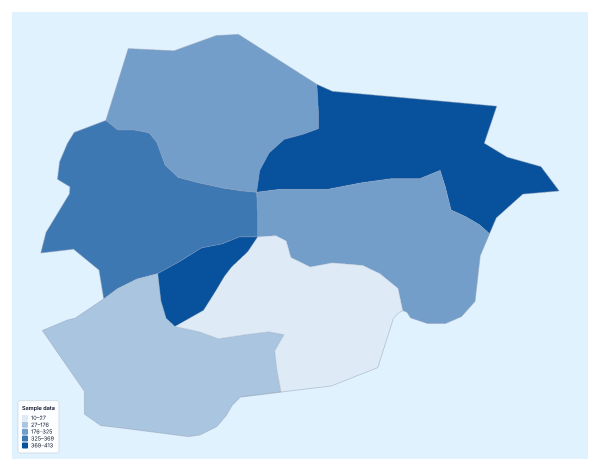
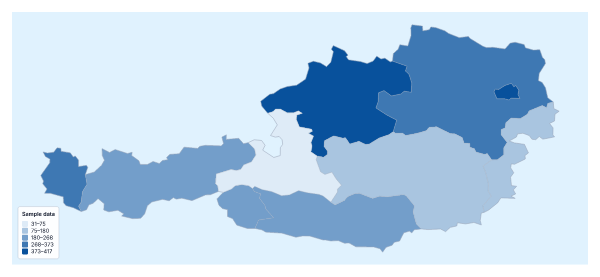
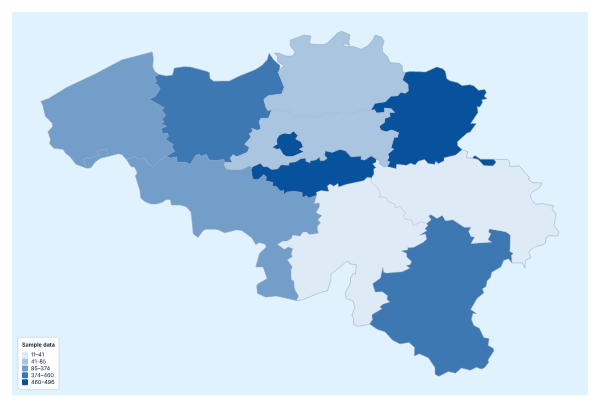
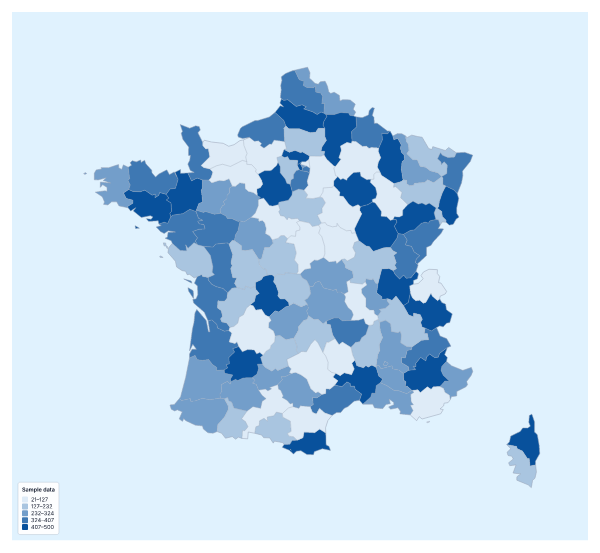
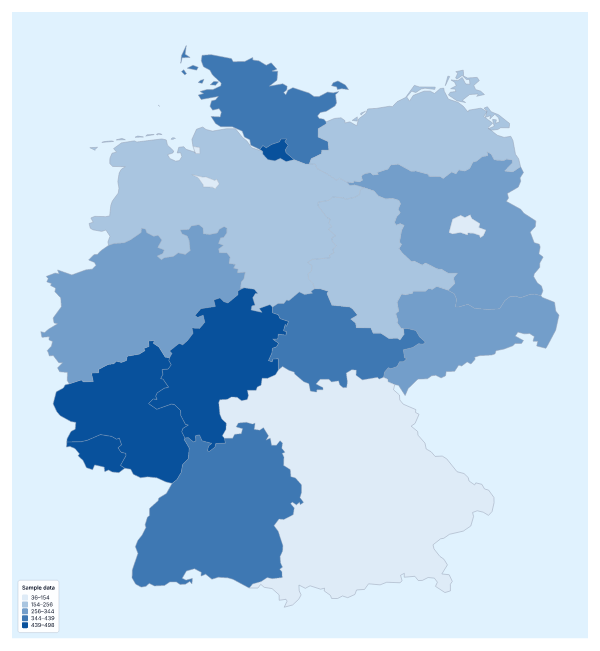
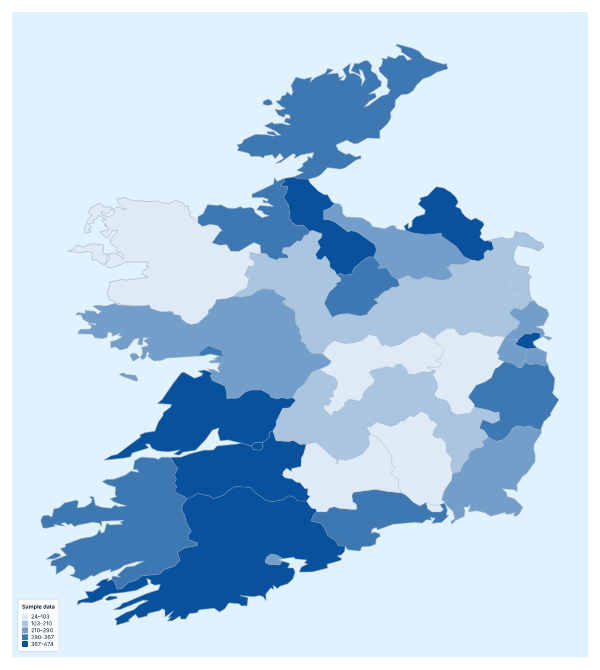
Maps of places in Western Europe
Questions people ask
Which countries can I add data for on the map of Western Europe?
The 17 countries this map counts as Western Europe, from Andorra to Vatican City. The blank spreadsheet on this page lists them all with a code the importer accepts, so you can fill in the values and paste them back.
Which names and codes for the countries does it recognise?
English names and many other spellings, in any case and with or without accents, and ISO 3166 country codes. UK, Great Britain, Holland, Deutschland and Holy See all match, so tables from different sources usually go in without editing.
What if I have no figure for some of the countries?
Leave those rows out. A country with no value takes the no data colour, which you can set in the Data panel, so the map shows plainly where your table has a gap rather than guessing.
Should I map totals or rates?
Rates, in most cases. A total often follows how many people live in each country, so for many measures the most populous come out darkest. Dividing by population or by area shows the pattern behind the numbers.