Editable map of Chinese provinces
Colour the regions, add cities and labels, and download it in minutes. Free, no sign-up.
Ideas for a map of Chinese provinces
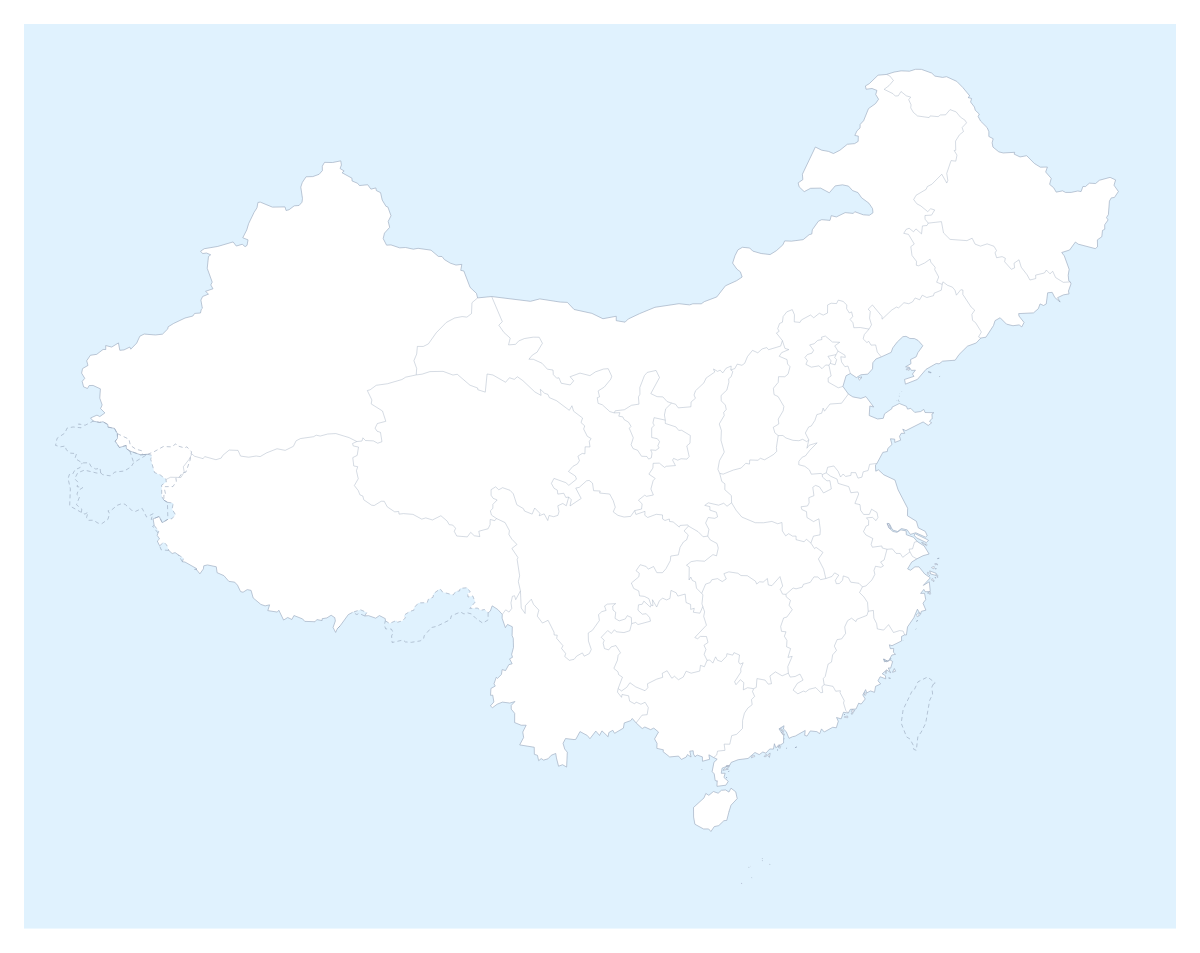
Supply chains, market plans and school projects on China all start from the same question: which area is which? This map opens in the editor with 32 administrative areas drawn as separate shapes, so you can colour them by factory cluster, sales region or topic and add the cities that matter to your plan.
Supplier maps and market plans
Give each supplier group or each sales region a colour, click the areas it covers and add a legend. A buyer can colour Guangdong, Zhejiang and Jiangsu one colour and Sichuan, Hubei and Hunan another, then pin Shanghai, Guangzhou and Shenzhen to show where the sites are. A market-entry slide works the same way: the first wave of areas in one colour, the next in a second, and a title that says what the colours mean.
Study and travel
A student can colour areas to match a reading, from Heilongjiang to Yunnan, and add a title and a short key. For a trip, pin Beijing, Shanghai and Guangzhou, join them with a route and numbered stops, and use the PNG in an itinerary. The editable map of China opens the country with the same areas, and the choropleth map of China colours them from a column of figures.
Setting it up
On the page, pick a colour and click. The Province lines switch shows or hides the lines between areas, so a cluster of neighbours can read as one block. In the editor, opened with Customise this map, the place list names every area, which beats clicking when you are colouring from a spreadsheet. The map is drawn with the international boundaries, and in the editor the Boundaries setting can draw them as recognised by one of several countries, with a boundary note.
For slides
A regional slide needs few colours and a legend you can read from the back of the room. Set the canvas to 16:9, save a PNG with Transparent on or use Copy image and paste. Minimal suits a board pack, Dark a deck with a dark theme. The map for PowerPoint page has more.
How to do it in MapMaker
- Pick a colour in the bar on the map and click the areas for one group, then repeat with the next colour.
- Choose Customise this map to carry on in the editor, where the place list names every area.
- Use Add your cities to pin Shanghai, Beijing or Shenzhen, and Add a title to say what the colours mean.
- Choose Download and save a PNG for slides or an SVG for a design tool.
Embed this map
Paste this code into your website to show this map of Chinese provinces, with a small credit link back to MapMaker.so.
Facts about Chinese provinces
This map shows 32 administrative areas in Eastern Asia. The capital is Beijing. The population is about 1.4 billion (2019 estimate). The largest cities are Shanghai, Beijing, Guangzhou, Shenzhen and Wuhan.
Questions people ask
How do I colour the areas on the map?
Pick a swatch in the bar on the map and click an area to fill it with that colour; click it again to clear it. The editor's place list names all 32 administrative areas, so you can choose any of them by name.
Can I mark supplier or office locations?
Yes, in the editor. Add your cities opens the pin tool with the city search; type Shanghai, Beijing, Guangzhou, Shenzhen or Wuhan and each pin lands in place, with a label you can edit.
How do I group areas into regions of my own?
Choose one colour per group and click the areas that belong to it, for example Guangdong, Zhejiang and Jiangsu in one colour. The legend gets a line per colour, which you can rename to your own region names.
Can I make the map fit a 16:9 slide?
Yes. In the editor, open the Canvas tab and choose the 16:9 slide size. Download a PNG with Transparent on if the slide has its own background, or use Copy image to paste the map straight in.