Editable map of US states
Colour the regions, add cities and labels, and download it in minutes. Free, no sign-up.
Ideas for a map of US states
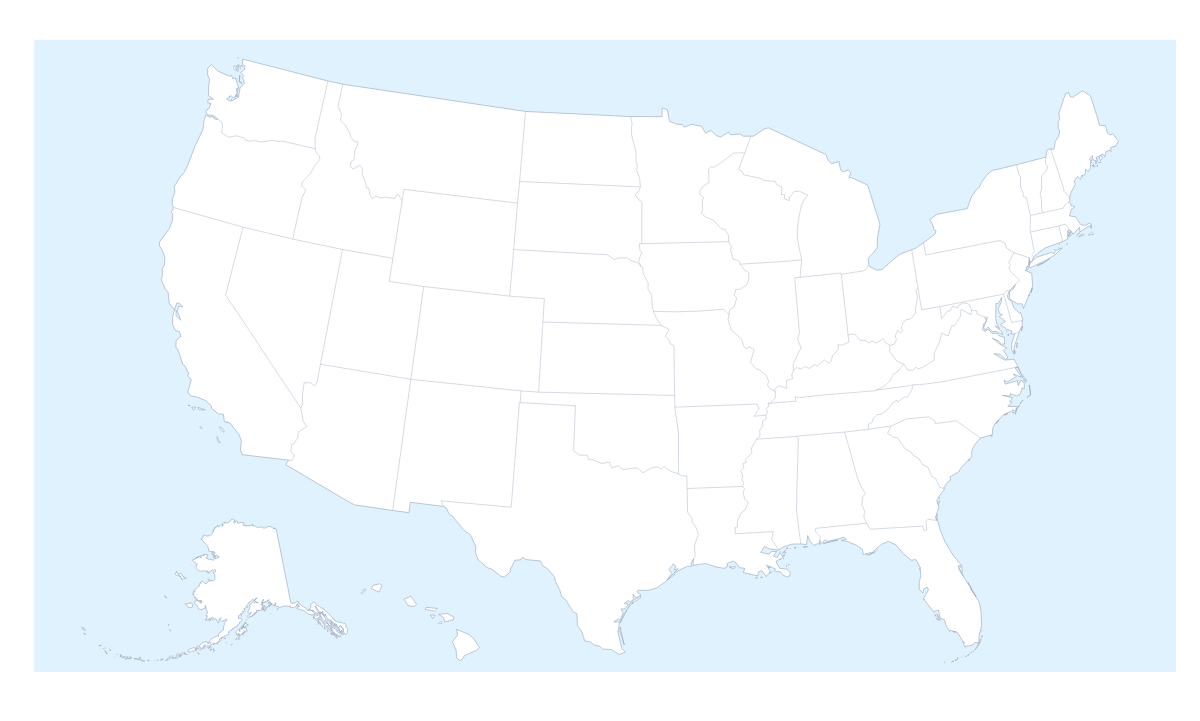
A map of the US states is the starting point for a sales territory slide, a class project on the states, an election night graphic or a road trip plan. This one opens in the editor with every state drawn and ready to click: 50 states and the District of Columbia, each a shape of its own to colour, name and group.
Sales territories and office maps
A national sales team can group the states into territories: one colour per region manager, each state clicked into place and a legend with the managers' names. Pin the offices too, for example in New York, Chicago and Los Angeles, so the slide shows who sits where. The country's own page, the editable map of the United States of America, opens with the same states drawn, so a territory map can start from either.
Projects, trips and election maps
Students can colour the states they have studied, show their names and add a title for a project or a display. For a road trip, pin the cities on the way, say New York, Philadelphia and Miami, and draw a route with numbered stops; the PNG goes straight into a trip journal or a blog post. On election night, colour each state by the party that won it and add a legend with the party names. With figures for every state in a spreadsheet, the choropleth map of the United States of America colours the states for you.
Making it yours
Start with the bar on the map: pick a colour and click the states you want. In the editor, opened with Customise this map, the place list names every state, so picking Rhode Island or Delaware from the list is quicker than finding them on the map. A click on a state there opens a small card with colours and Show names. Add your cities opens the pin tool with the city search ready, and Add a title puts the cursor in the title field. The Neighbours switch on the map draws Canada and Mexico around the states. For the style, Minimal suits a report, Dark a slide with a dark theme and Vintage a road trip poster.
Getting the file out
PNG or JPG suits PowerPoint, Google Slides and Keynote; SVG keeps the state lines sharp for Illustrator, Inkscape or Figma; PDF on Letter, A4 or A3 is for print. Set the canvas to 16:9 before you start if the map is going into slides, so it fills the slide from edge to edge. To print blank copies for a class, use the printable map of the US states.
How to do it in MapMaker
- Choose Customise this map to open the US states in the editor with every state listed, keeping any you coloured with the bar on the map.
- Click a state, or pick it from the list, and give it a colour on the card.
- Pin New York, Chicago or Miami with Find a city, and add a title on the Canvas tab.
- Choose Download and save a PNG for slides or an SVG for a design tool.
Embed this map
Paste this code into your website to show this map of US states, with a small credit link back to MapMaker.so.
Facts about US states
This map shows 50 states and the District of Columbia in Northern America. Together they have an area of about 9,450,000 km². The capital is Washington, D.C. The population is about 330 million (2019 estimate). The largest cities are New York, Los Angeles, Chicago, Miami and Philadelphia.
Questions people ask
How do I colour the US states?
Pick one of the swatches in the bar on the map and click a state to fill it with that colour; clicking it again clears it. To work through a list instead, choose Customise this map: the editor's place list shows all 50 states and the District of Columbia by name, from Alabama to Wyoming.
How do I group states into territories?
Choose one colour per territory and click each state that belongs in it. The legend gets one line per colour; rename each line under Legend labels in the Data panel, for example West, Central and East, or the name of the rep.
Can I show the names of the states on the map?
Yes. Select the states you want named and choose Show names on the card. Naming all of them can crowd a small slide, so name only the states the slide is about and leave the rest to the legend.
Can I draw a route between US cities?
Yes. Pin New York, Chicago and Los Angeles with the city search, then join them with the Route tool. Numbered stops show the order of the trip, which suits a road trip plan or a sales tour.