Choropleth map of Antarctica
Paste your numbers and get a colour-coded map with a legend.
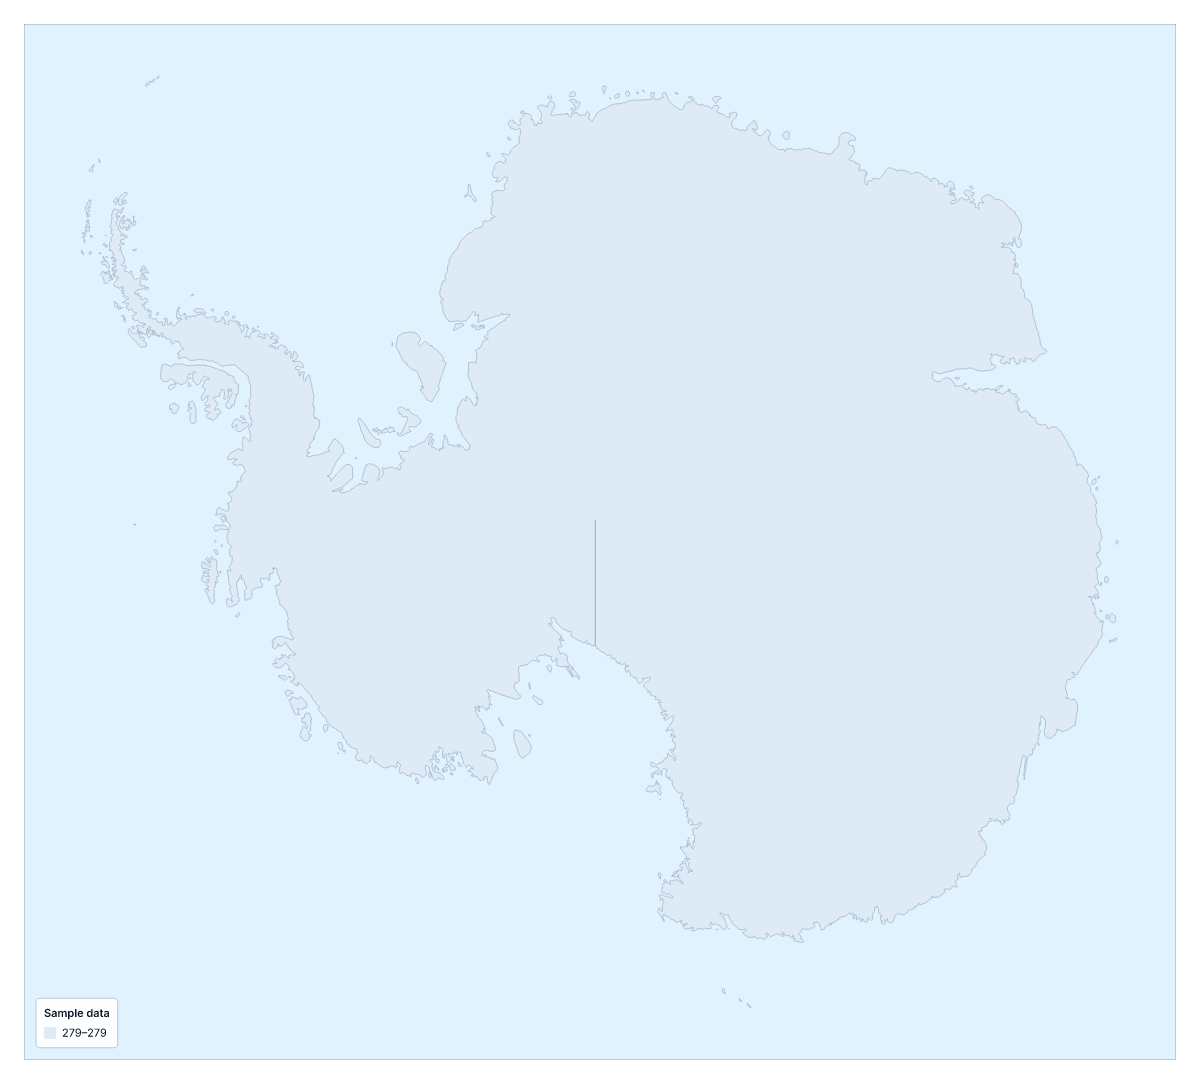
Your data on a map of Antarctica
On its own, the map of Antarctica is a single shape, so one value colours all of it. That is worth knowing before you paste anything. This page suits one figure or one label for Antarctica, shaded with a legend; for a comparison between places, the world is the better map.
What a choropleth does
A choropleth shades each area by its value, usually darker for more, and a legend explains the shades. The idea needs several areas to compare. Antarctica has none inside it on this map, so the result is one colour and a legend, which still works for a slide that needs one number or one label shown on the shape. The colours above are sample data.
When this page helps
If the slide is about one figure for Antarctica, such as a survey score or a count from your own records, one row shaded with a legend and a data title puts the figure on the map. A label works as well: use the Categories method and the legend names it.
To compare Antarctica with other places, take your two columns to the choropleth map of the world, where each country takes its own value and the shades have something to be compared against.
Getting one row in
Type Antarctica in the first column and the value in the second, or paste both from a spreadsheet; Upload a CSV also works. The importer reads several spellings and the ISO 3166 code. Limits of 5,000 rows and 2 MB will not matter here. There is no blank spreadsheet to download, since there are no regions to list.
Colour
With one value, the method makes little difference: choose one colour scale from light to dark, or Categories for a label. Add a data title so the legend says what the colour means.
How to do it in MapMaker
- Type Antarctica in the first column and its value in the second, then paste the two columns into the box above.
- Choose Make my map, or Upload a CSV if the value is in a file, to open Antarctica with your data on it.
- Pick a colour scale in the Data panel, or the Categories method if the value is a label, then add a data title.
- Choose Download to save the map with its legend as a PNG, SVG or PDF.
Facts about Antarctica
This map shows Antarctica. The population is about 4,500 (2019 estimate). Its status is disputed.
Questions people ask
Can I colour Antarctica on its own?
Yes, but the map has no regions, so Antarctica is a single shape and one value colours all of it. Paste one row, Antarctica and a value, and the editor shades the whole shape and draws a legend.
How should I lay out my spreadsheet for Antarctica?
Use two columns: the place in the first and the value in the second. For this map the place column has one row, Antarctica. There is no blank spreadsheet here, because there are no regions to list.
Where can I compare Antarctica with other places?
On the choropleth map of the world, where each country takes a value from a column of country names or ISO 3166 codes, and you can compare places side by side. Use that page when you have figures for more than one place.
Can I map categories instead of numbers?
Yes. Choose the Categories method in the Data panel and put a label in the value column. A single row gives one colour and a legend line, which suits a label such as a survey group or a project name.