Editable map of Antarctica
Colour the map, add cities and labels, and download it in minutes. Free, no sign-up.
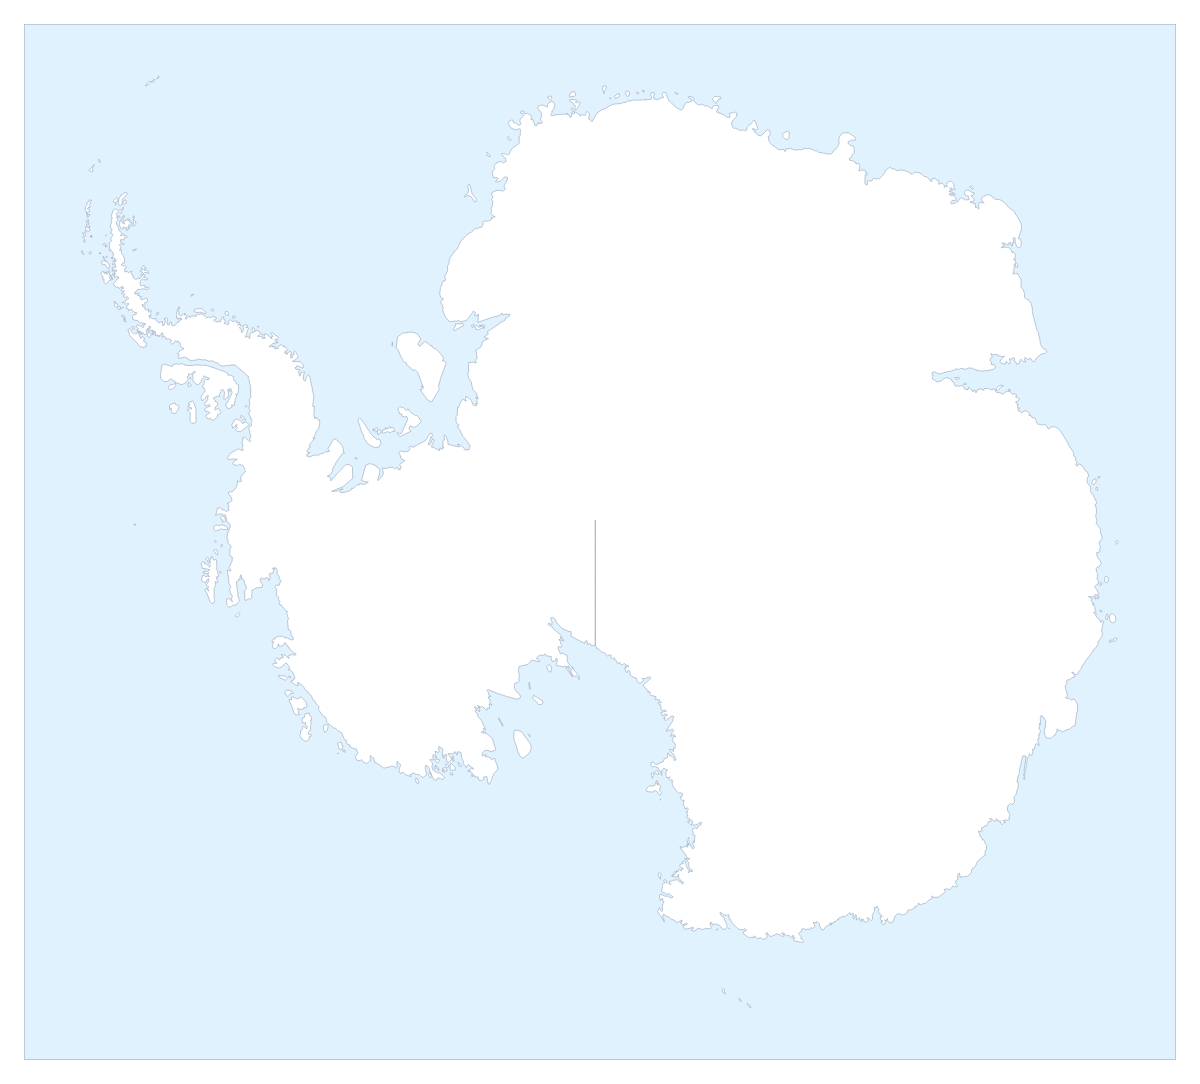
Ideas for a map of Antarctica
A map of Antarctica is usually wanted for a topic rather than a territory: a science lesson, a talk about the poles, a poster for a school display. The map above looks down on the South Pole, and it opens in the editor ready to change. It has no regions inside it, so what you add is your own: a colour, pins, a title and a legend.
Projects that use the whole shape
Pupils can mark places they have researched with numbered pins and explain each number in a legend beside the map. A presenter can put the globe on a slide with a short title and a source line underneath, for a talk on any polar subject. A designer can restyle it in Blueprint for a technical look or Vintage for a poster. A team with a spreadsheet of coordinates can paste the latitude and longitude values and have a pin drop for every row.
Making it yours
A click on the map colours Antarctica as one shape, so the bar on the map is for its fill, the weight of the coast line under Borders, and Sea, which turns the sea white or back. For anything more, choose Customise this map. Add your cities opens the pin tool, where you click the map and type a name for each pin, and Add a title opens the title field. In Place settings, Grid lines draws lines of latitude and longitude, which helps when pupils need to read a position off the map.
Leave the toolbar's projection switch on Globe unless you have a reason to change it, since the flat view stretches the shape.
Files and slides
PNG or JPG suits a document, SVG suits Illustrator, Inkscape or Figma, and PDF is for print. For a deck, set the canvas to 16:9 and pick Dark for a dark theme or Minimal for a light one. Then save a PNG with Transparent on, or use Copy image in the Download dialog. The map for PowerPoint page has more on decks. A lesson that places Antarctica among the other continents can start from the editable world map, and a copy for the classroom wall prints from the printable map of Antarctica.
How to do it in MapMaker
- Pick a colour in the bar on the map and click Antarctica to fill it, then switch Sea on or off to suit your background.
- Choose Customise this map to open Antarctica in the editor as a globe over the South Pole.
- Choose Add your cities to open the pin tool, click the map for each pin and type its name, then add a title on the Canvas tab.
- Choose Download and pick PNG for a slide or SVG for a design tool.
Embed this map
Paste this code into your website to show this map of Antarctica, with a small credit link back to MapMaker.so.
Facts about Antarctica
This map shows Antarctica. The population is about 4,500 (2019 estimate). Its status is disputed.
Questions people ask
How do I colour Antarctica on the map?
Pick a colour in the bar on the map and click Antarctica. The map has no regions, so a click fills the whole shape; click again to clear it. Sea turns the sea white or back, to suit the background you are using.
Can I add my own pins to the map of Antarctica?
Yes. Choose Add your cities, click a spot on the map and type your own name for the pin. To drop many at once, paste a list of latitude and longitude values from a spreadsheet into the Data panel in the editor.
Why does the map of Antarctica look like a globe?
Antarctica opens in the editor as a globe over the South Pole, because a flat projection stretches it along the bottom of the map. To change it, switch the projection in the toolbar from Globe to Flat or Natural.
Can I use the map of Antarctica in PowerPoint or Google Slides?
Yes. Save a PNG with Transparent on, so your slide's own background shows, or use Copy image in the Download dialog and paste it straight into the slide. A canvas of 16:9 fits a standard slide.