Choropleth map of Côte d'Ivoire
Paste your numbers by region and get a colour-coded map with a legend.
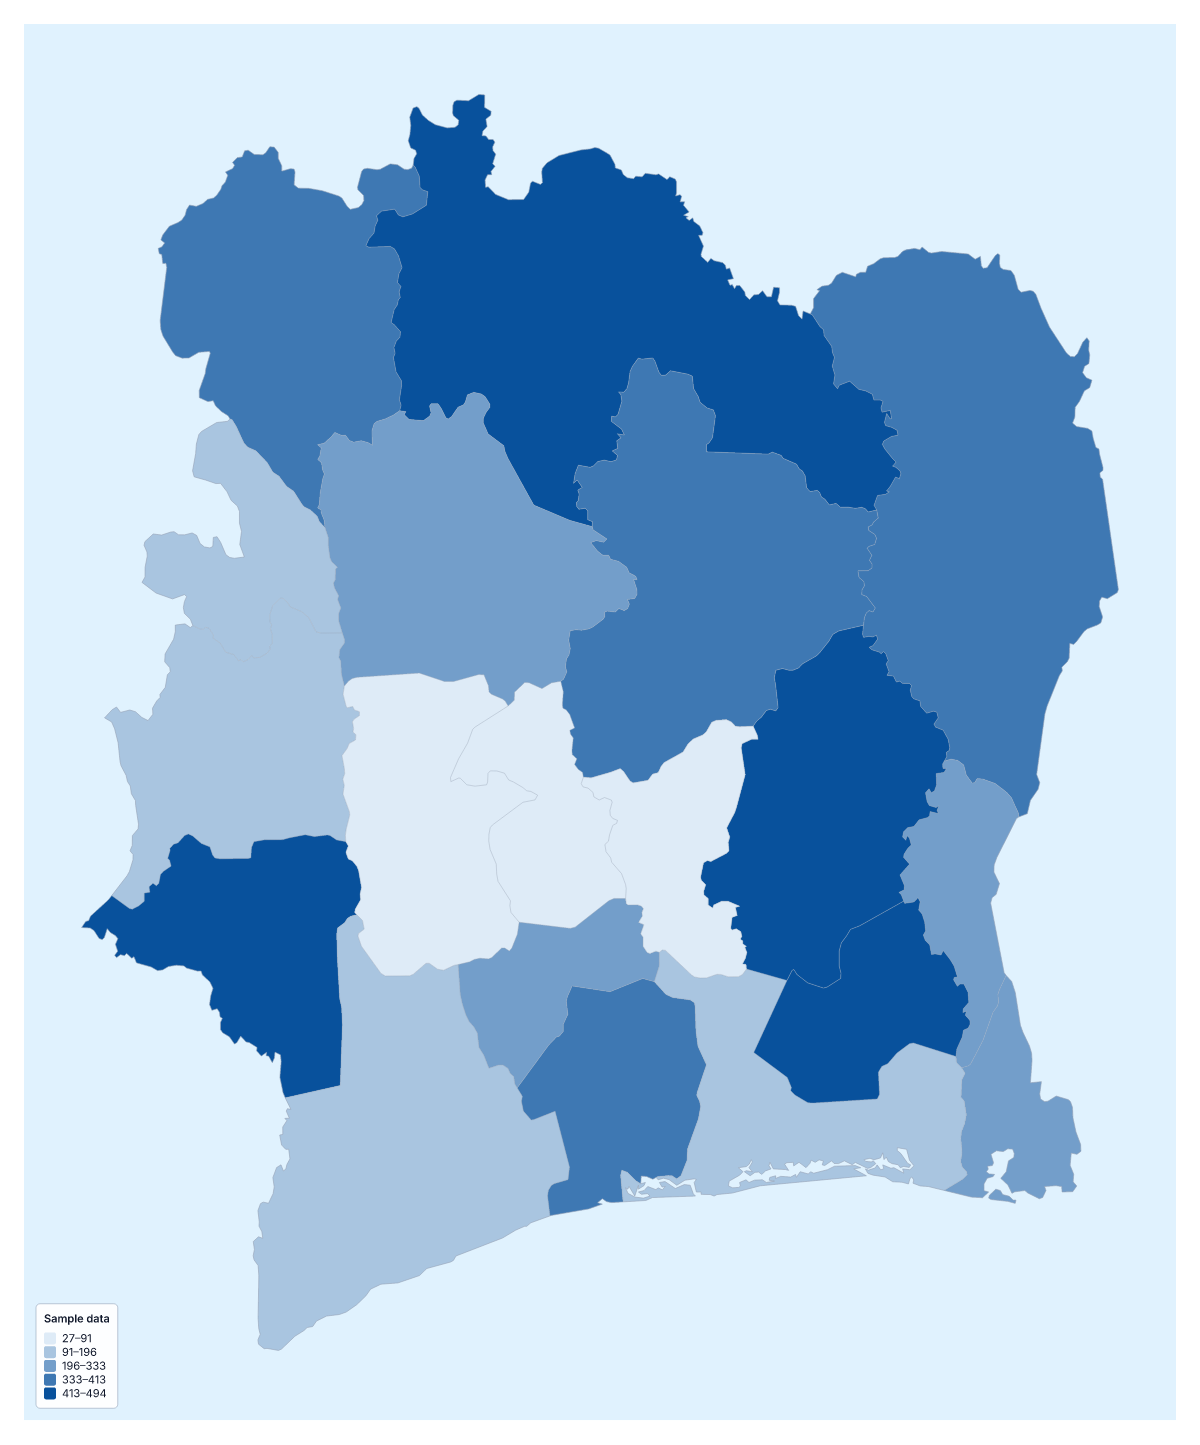
Your data on a map of Côte d'Ivoire
Paste a value for each of Côte d'Ivoire's 19 administrative areas and the map shades them for you: one column for the area, one for the figure, then Make my map. Everything coloured on this page is sample data.
A shaded map, in short
A choropleth colours each area by its value, so a reader can compare areas at a glance and read the legend for what each shade means. It works for rates and comparisons. It is not for exact figures or for points such as shops, which belong on the editable map of Côte d'Ivoire as pins.
Who maps what
A retailer might shade the areas by customers per person, or by the number of dealers, to see where to add one. A researcher with a survey can map the average score for each area. A school or charity can map enrolment or the reach of a programme. Where figures are held by city, such as Abidjan or Bouaké, assign each city to its area before you paste.
Names, accents and codes
Area names such as N'zi-Comoé, Vallée du Bandama and Haut-Sassandra carry apostrophes, hyphens and accents, and the importer is forgiving: it ignores case and accents, and also reads ISO 3166-2 codes. Rows that do not match are listed with suggestions, to fix, skip or remember. The blank spreadsheet of the 19 areas gives you the exact names. A paste can be up to 5,000 rows and 2 MB.
Choosing how to colour
Population in the fact sheet is about 25.7 million (2019 estimate), so a total tends to follow where the most people live; divide by population for a fair comparison. Quantile gives each step a similar number of areas. Natural breaks groups values that sit close together. Categories gives one colour per label, for example which team serves each area, and the legend lists the teams.
How to do it in MapMaker
- Put the area names in one column and the values beside them, then paste both into the box.
- Choose Make my map to open Côte d'Ivoire with your data on its 19 areas.
- Fix any unmatched rows, then choose a method and five classes in the Data panel.
- Add a data title and choose Download for a PNG, SVG or PDF with the legend.
Facts about Côte d'Ivoire
Côte d'Ivoire is in Western Africa. The capital is Yamoussoukro. The population is about 26 million (2019 estimate). Côte d'Ivoire has an area of about 322,000 km². The largest cities are Abidjan, Bouaké, Daloa, San-Pedro and Yamoussoukro. It borders Burkina Faso, Ghana, Guinea, Liberia and Mali. The map divides it into 19 administrative areas.
Maps of neighbouring places
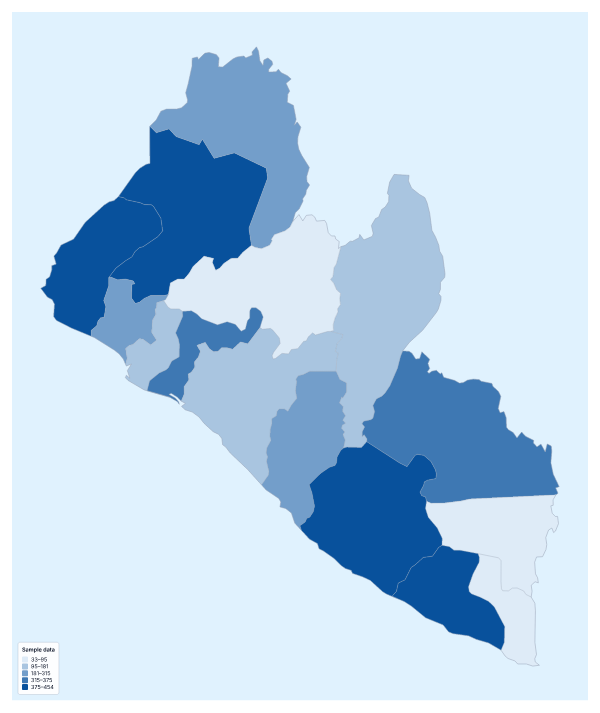
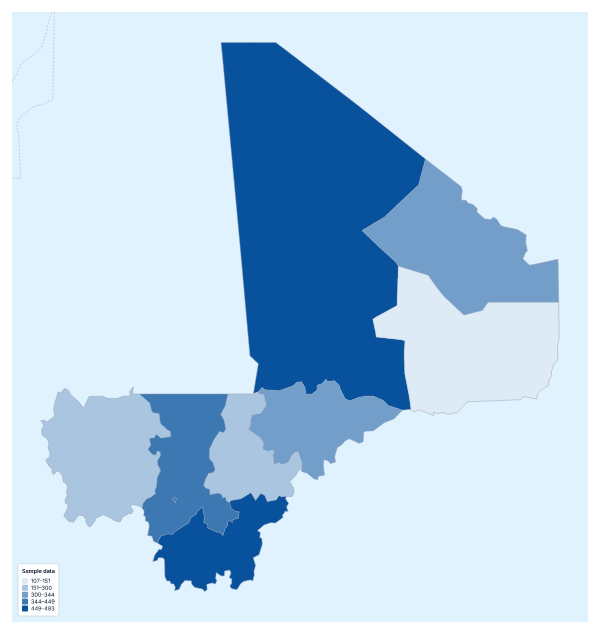
Questions people ask
Does the importer cope with accents in Côte d'Ivoire's area names?
Yes. It matches names with or without accents and in any case, so Agnéby, Comoé and Vallée du Bandama can be typed plainly or with their accents. It also reads ISO 3166-2 codes.
Is there a blank spreadsheet of the administrative areas of Côte d'Ivoire?
Yes. The page offers a CSV with all 19 areas, their codes and an empty Value column. Fill in the values and paste the two columns back into the box.
Which data suits a map of Côte d'Ivoire?
Anything with one figure for each of the 19 areas: customers, branches, survey scores, school enrolment or the reach of a project. Rates give a fairer picture than counts.
How many colour steps should I use?
Four or five suit 19 areas. Fewer steps make a simpler legend, more steps show finer differences. You can change the number in the Data panel and the legend updates as you do.